
This was my first data and statistics project since leaving my economics course at university. Eager to further my knowledge, I had realised early on that the traditional linear regression models that I was familiar with were not going to be needed to predict a binary outcome. Although, they were going to be useful. So, I began by researching a university lecture series on logistic regression modelling. After digesting the mathematics, I was ready to work with my raw data.
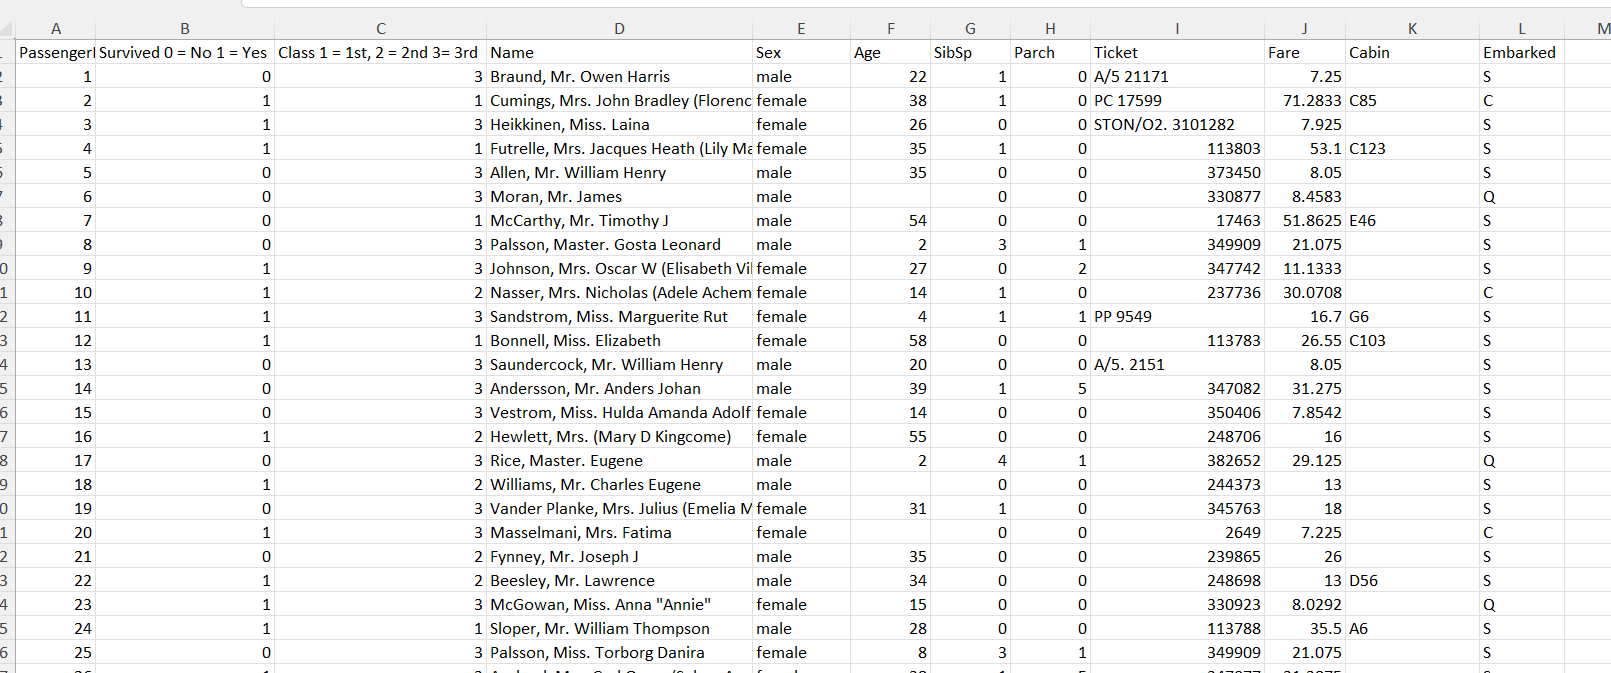
I began by cleaning and simplifying my data. Although some of the columns here would’ve been useful for prediction, I wanted to simplify everything so I could get a better understanding of logistic regression modelling. Leaving myself with ‘Age’, ‘Class’ and ‘Sex’ as my determining factors, I began exploring options for the empty age cells. After doing some research on normality testing, I decided to use a Kolmogorov-Smirnov test to see if using the median ages for both males and females would be an appropriate imputation for the age column.
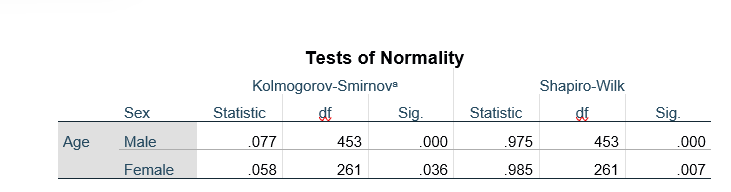
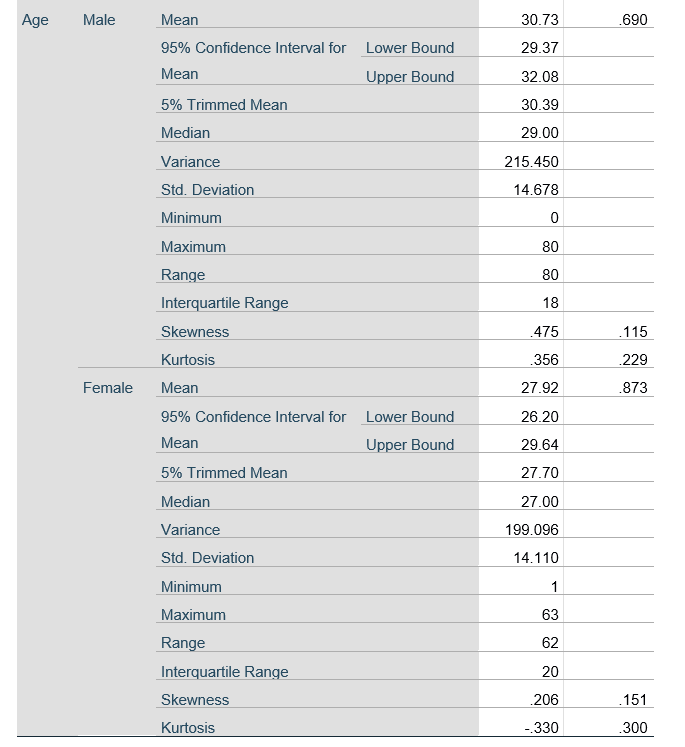
Based on the results, the median would not have been completely appropriate; the kurtosis values suggested that there was no accurate way of telling if a passenger without age data was around the median age, the age of an enfant or anywhere in between.
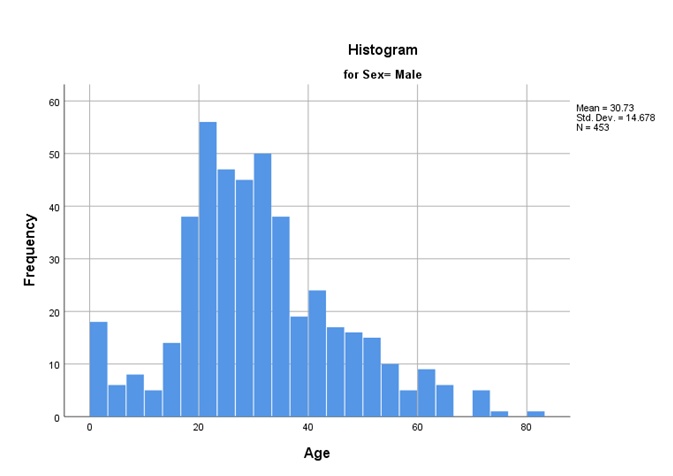
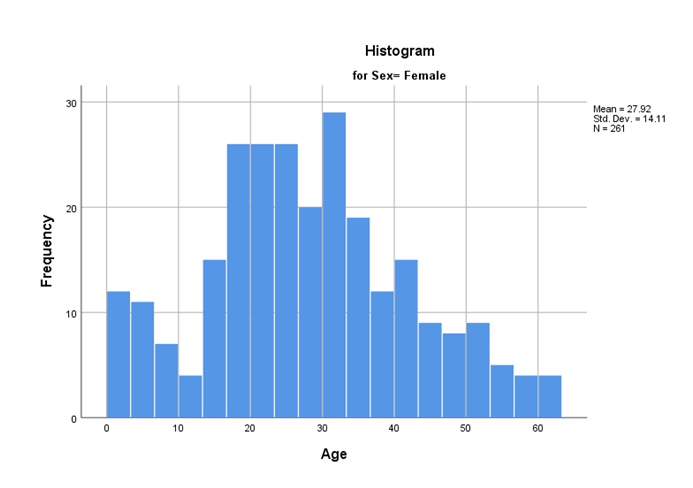
As there were not many gaps in the Age column, I simply deleted them from the data. I then turned all gender data into either a 1 (for male) or 0 (for female), so it could be fed into a logistic model.
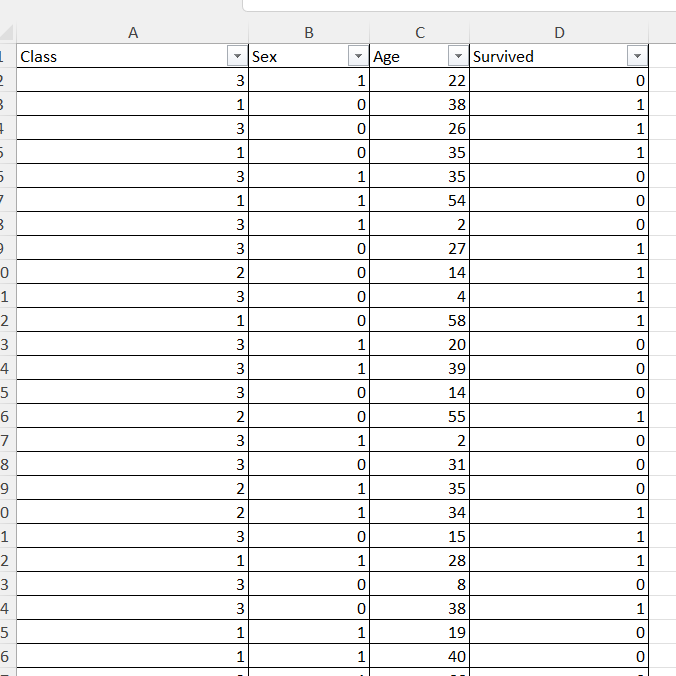
I then started doing some simple descriptive statistics to get a feel for my data. I also did some background research into the Titanic’s evacuation policy.
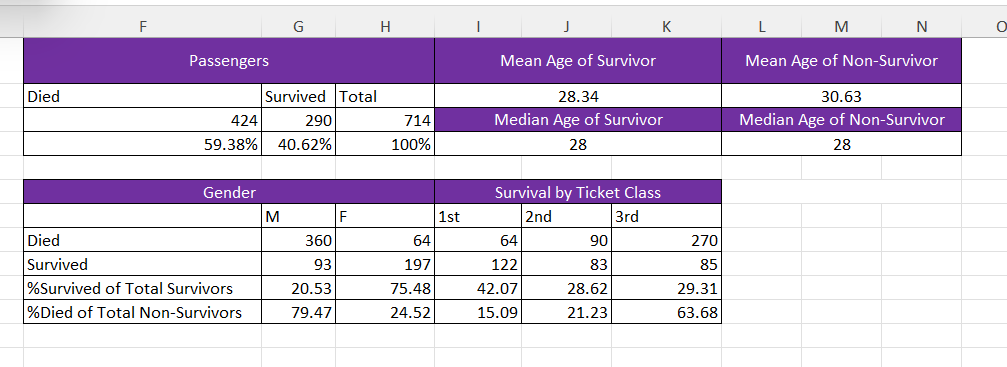
The results of the descriptive statistics gave me my first two important coefficients: Gender and Class -you were more likely to survive if you were female and in 1st class. The ‘women and children first’ policy, that we all associate with the Titanic, seems to hold true.
This led to my third and most important coefficient, age, anyone below the age of 28 was more likely to survive. This again made sense considering the ‘women and children first’ policy.
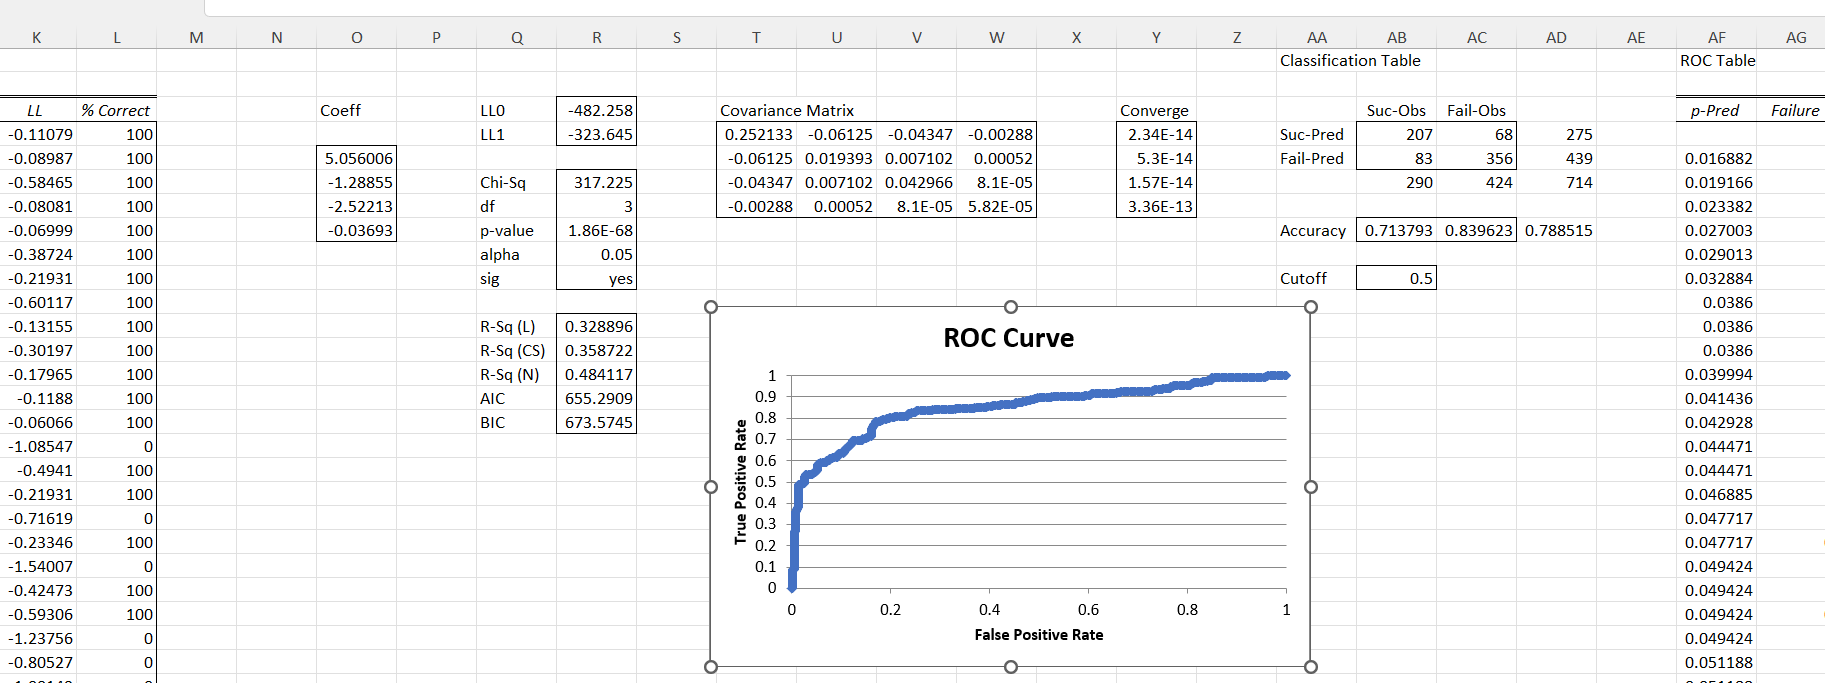
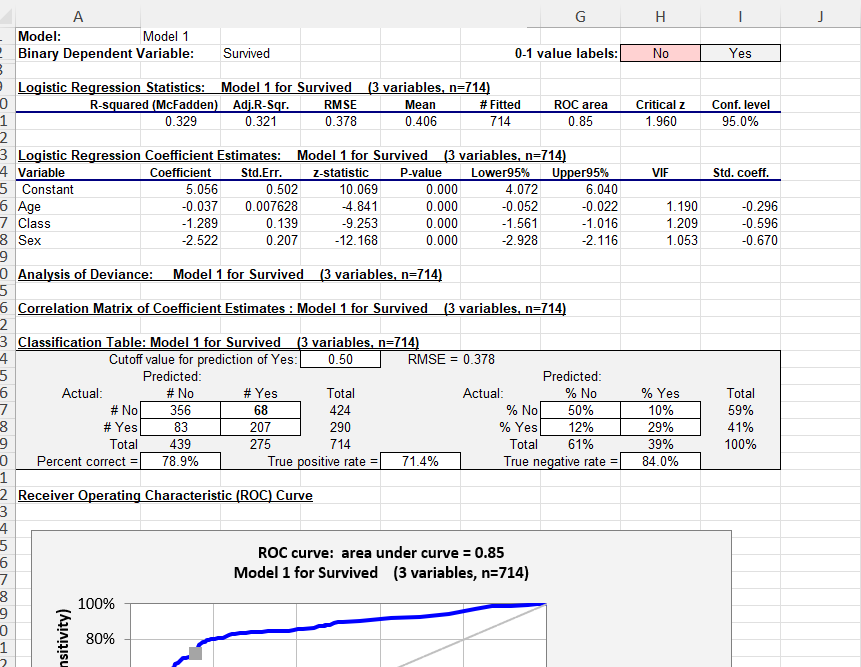
With my coefficients chosen, I performed a logistic regression with some simple excel functions – essentially working it out by hand. Afterwards, I downloaded some custom add-ons for excel that performed logistic regressions. After checking them against my first answer, I could be sure that the calculations were correct.
By Hand:
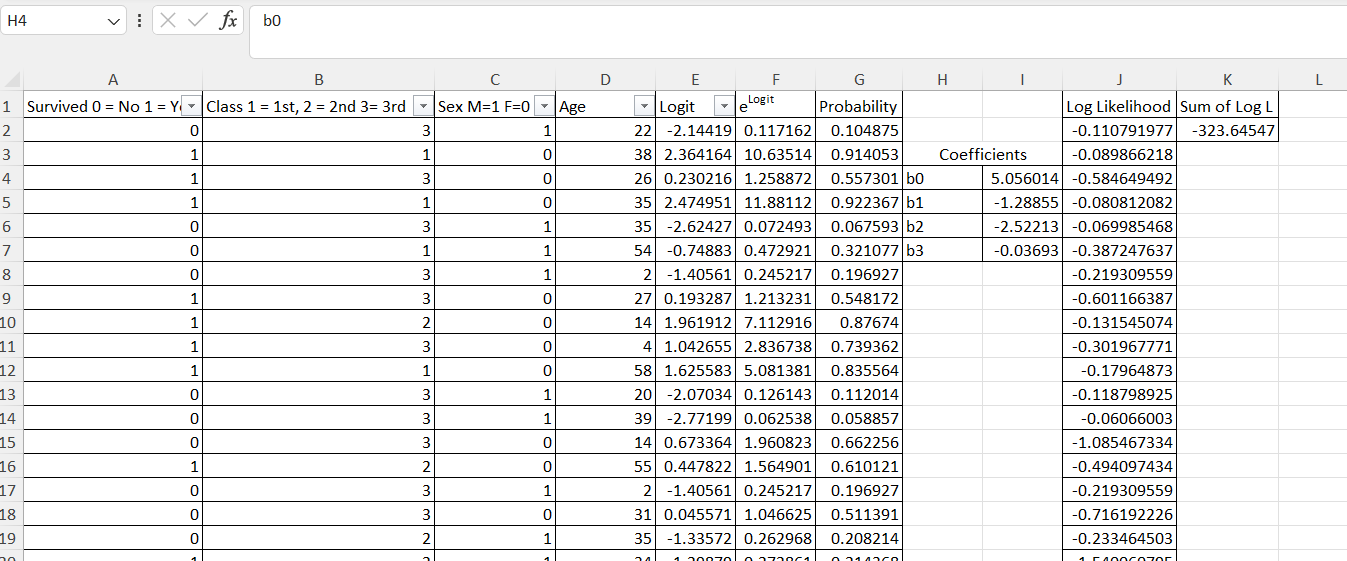
Real Stats Plugin:
Regressit Plugin:
After figuring out my coefficients, I was able to build my first model and test it on the test data provided by Kaggle.com. I am happy to say that my first model scored in the top 15% of contestants (1582 of 13747). My Confusion Matrix, ROC curve, Accuracy, Precision and Recall scores were all acceptable (for a first try) – if you want to read about how those metrics are calculated, have look at my portfolio piece on logistic regressions and Python.
